Getting started
This document describes how to start using Flowerer, from this page, to have a dashboard ploting some data.
Creating the account
To start using the platform, you need an account. An account is automatically created when you log in using any of the OAuth providers. From the OAuth provider, we retrieve your name, first name and email address.
For this, you have to go to Flowerer login, or basically to https://app.flowerer.io.
In that page, click on the button of your preferred system, it will navigate you to their system to confirm access and send you back inside Flowerer already.
You can once you have logged in, connect your account with other OAuth providers.
You are inside
After the login is successfully done, you should be inside the system. It should look as:

The top part of the application allows you to navigate through all the relevant parts of the application.
- Flowerer logo: You will be brought back to home whenever you click on it.
- Quick search: quickly search in all the revelant entities of the system (Alarms, Dashboard, Sources or Devices).
- Project selector: Allows you to limit your view to an specific project, so that you filter out the entities to only those projects.
- Alarms: Access to the alarms.
- Dashboards: Access to the dashboards.
- Sources: Access to the sources.
- Devices: Access to the devices.
- Theme selector: Allow to change from automatic (default), bright mode or dark mode.
- Account: Access to the user account, all the settings, sessions, billing and logout.
We are proceeding now to create the first dashboard. However, in order to plot some data, we need such data first, so let's create a data source.
Creating a source
A Flowerer source is the only place where the data lives. A source is the place where the data is stored. As the data is stored, it is also broadcasted to feed in real time all the dashboards that you have created.
Let's create a source, but going to the https://app.flowerer.io/projects/any/sources (or by clicking on the top menu to Sources).
Once there, let's click on Create source:

And now, let's give a name to our source, for example First source and click on Create:

After the creation is done, you should see the details page of the source.
There are many things in this screen, but do not feel overwhelmed, as there is no need to understand them yet.
So far, we have created a source, but, how do we make the data to arrive to this data source? For that, we need to create an endpoint. And endpoint is the way that Flowerer has to expose a connection where you can send data. There are different protocols (HTTP, MQTT, TCP and UDP), but let's go with the simplest case, a normal HTTP endpoint. This endpoint will expect us to send a JSON document, but this JSON document is not completly schema free, as there is a small constrant. We will see it once we try to send data.
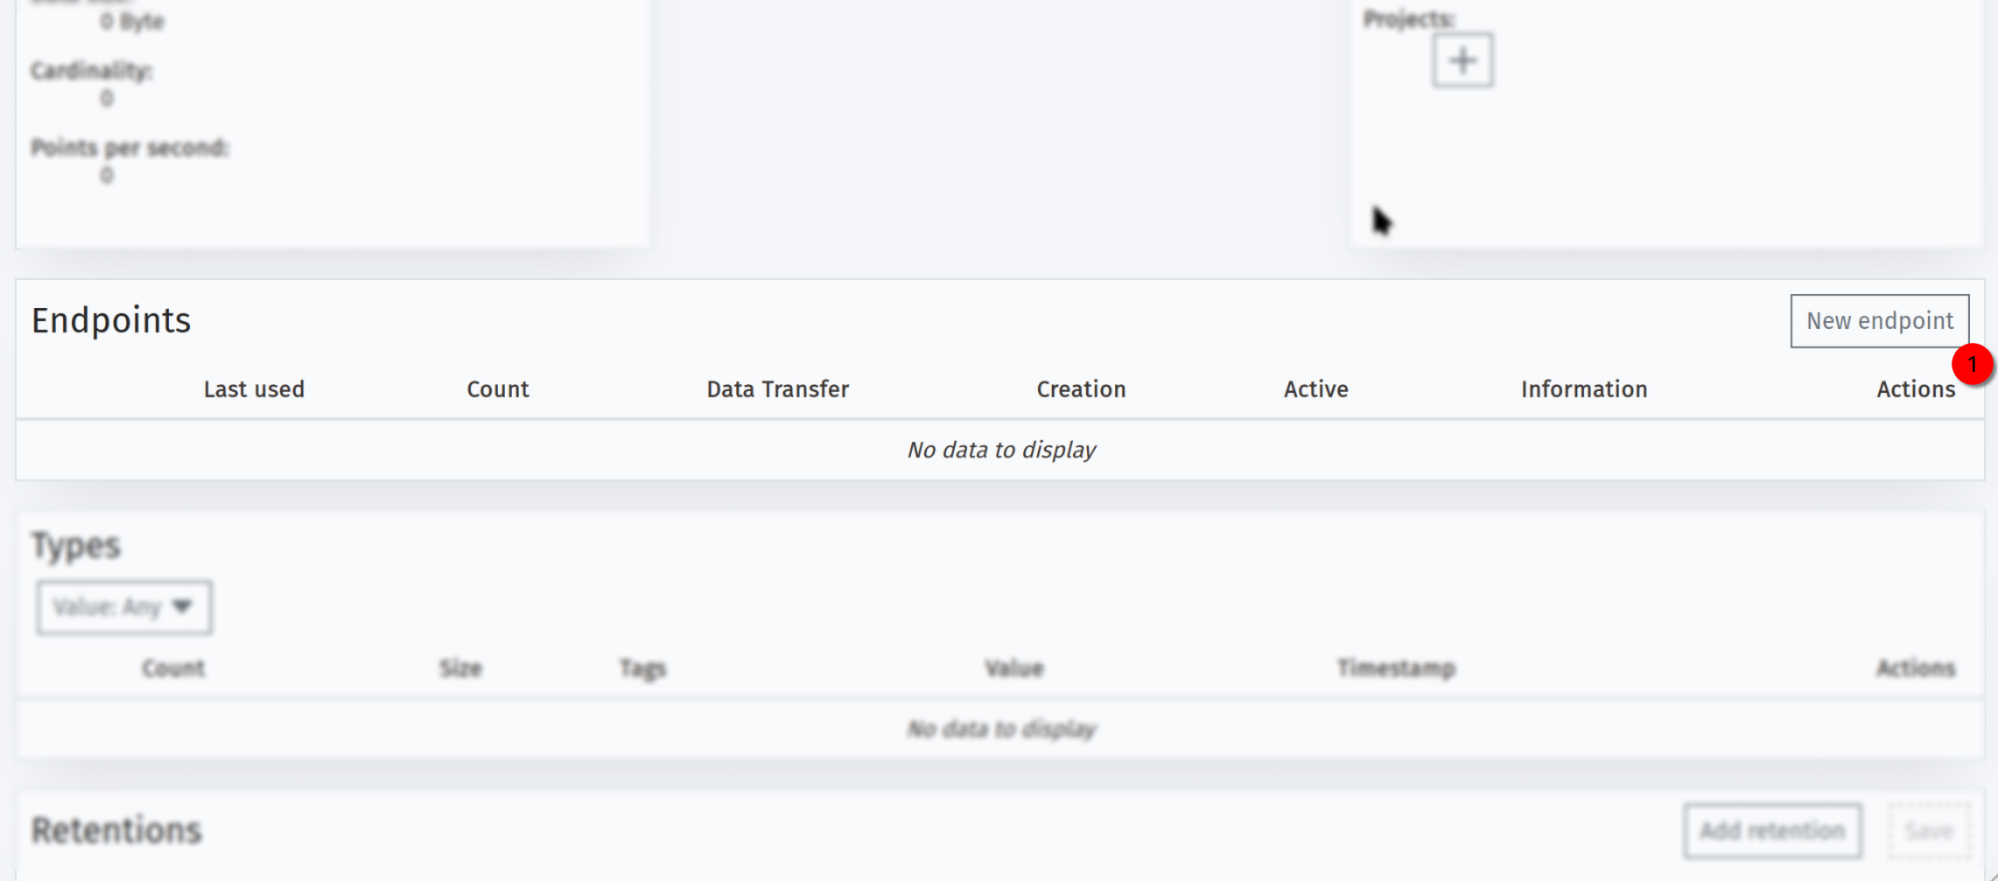
Let's create the endpoint by finding the card titled Endpoints, and clicking on the top right button that says New endpoint:
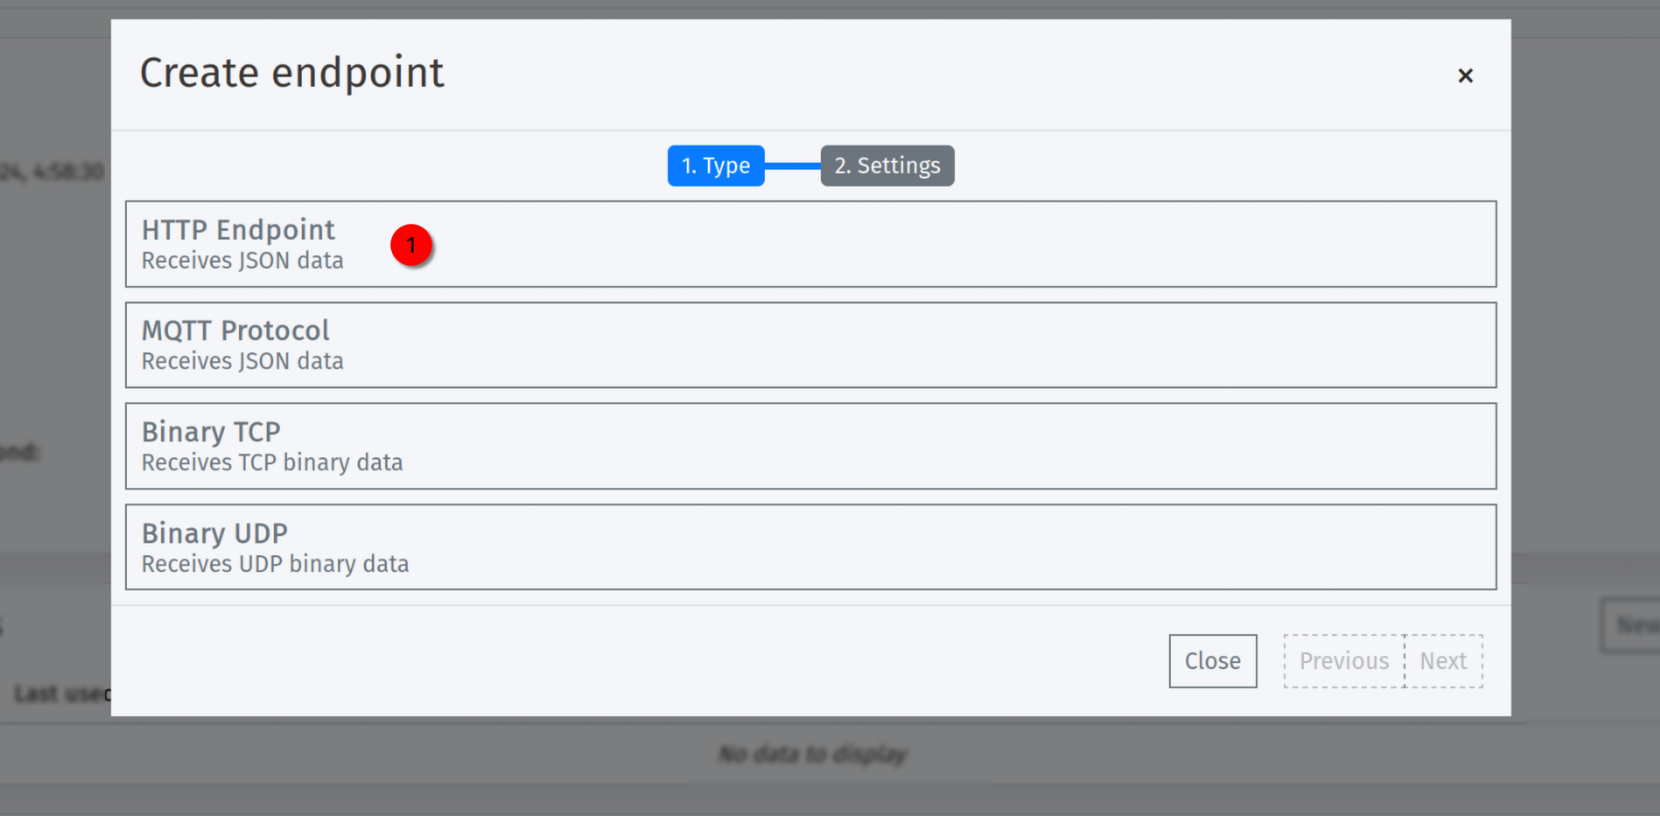
In the modal window that pops up, we select HTTP Endpoint:
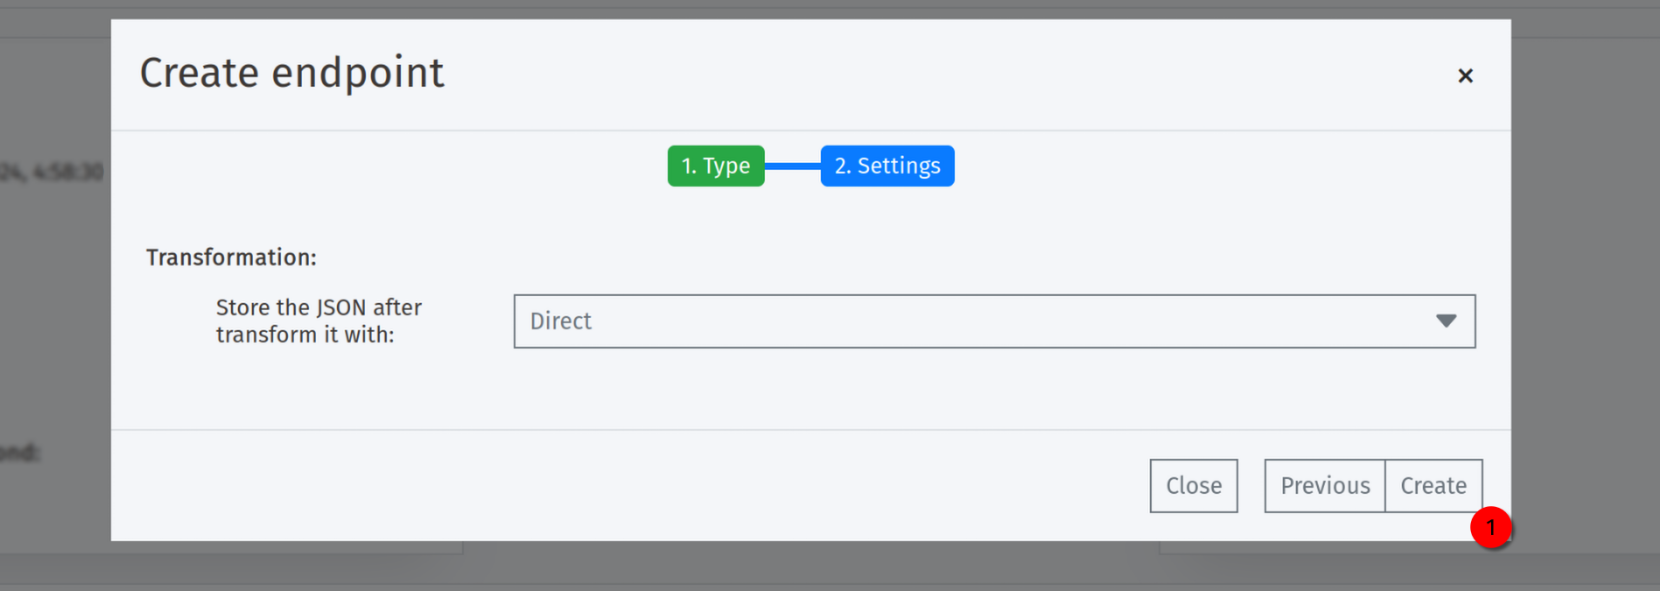
The modal window will take us to the second page to adjust the endpoint that we want to create. in this case, it asks us if we want to make any transformation to the data that we receive. In this case, we leave it as direct and click on create:
The endpoint will automatically show in in the card containing the endpoints. For example:

Sending some data
Once we have the endpoint created, we can see which URL we should use to send the data, in this case, it is https://http.endpoints.flowerer.io/api/v1/d08dfc1f-5116-4f71-9a8c-9fd8a75e607d.
We send here unstructured data, however, Flowerer needs some extra information to be able to document correctly your data. For this, you have a tags section, and an optional timestamp (if ts not specified, the system assumes the time of point arrival to the system as the instant of time when the point happened). So, the format will be:
{
    "tags": {
        "machine": "kp12-07",
        "location": "Berlin",
        "region": "Germany"
    },
    "value": {
        "efficiency": 0.93,
        "speed": 42,
    },
}
In this data point, we are tagging the point {"efficiency": 0.93, "speed": 42} to the machine kp12-07 which is located in "location": "Berlin" in "region": "Germany".
In order to send the point, we can just curl it:
curl https://http.endpoints.flowerer.io/api/v1/d08dfc1f-5116-4f71-9a8c-9fd8a75e607d -d '{"tags": {"machine": "kp12-07","location": "Berlin","region": "Germany"}, "value": {"efficiency": 0.93, "speed": 42}}'
If you go again to the source details page, you will see that the point is appearing in the card called types:

The size of the point is only 5 bytes. Flowerer automatically detects the field types to optimize storage size. You can also see in the endpoints card that the endpoint was used, that it got 1 point and that the point transfer was 5 bytes. Obviously, the protocol data (HTTPS in this case) is not accounted here.
We already have data, and a way to send it to the system. Let's try to plot it now.
Create a dashboard
A dashboard is the way to represent the data in Flowerer. As we did for creating the source, we need to go to the Dashboards (or by going to https://app.flowerer.io/projects/any/dashboards).
Let's click on Create dashboard:

Let's name to our dashboard, for example First dashboard and click on Create:

Once we click on crate, the system will automatically create the initial version and will take us to the editing page (background pattern with diagonal stripes). In this mode, we can modify the dashboard and the plots that compose the dashboard.
A dashboard is composed by plots, which define their own content. We have many different types of plots (time series charts with lines, scatter, bars, candles, or a map, or a Choropleth, or Markdown content, tables, commands etceter).
Let's create the first plot by clicking on "Add Plot` on the top right of the page.
After clicking, the plot will appear with blank content for now. Let's edit it:
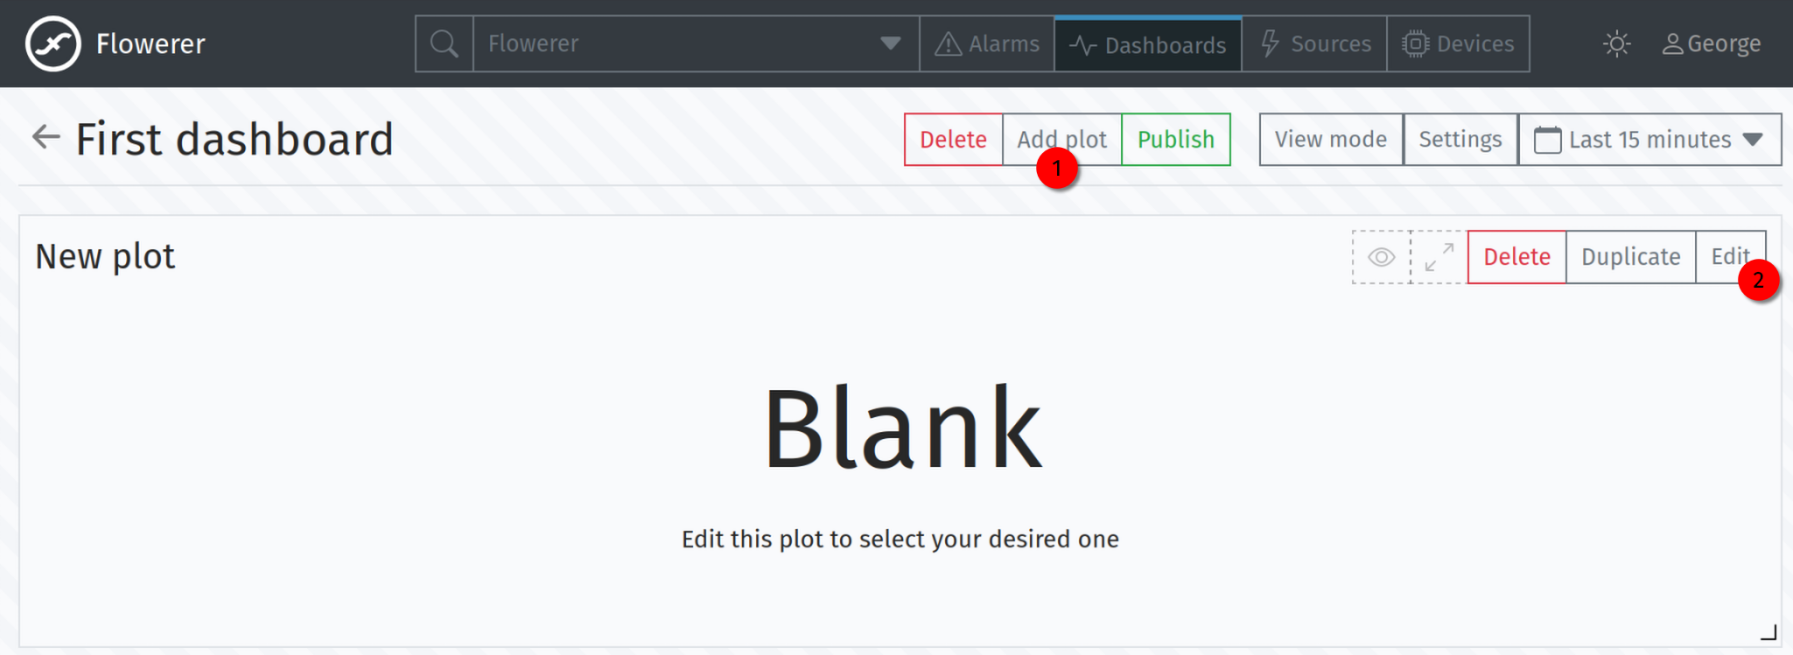
Here we configure the layout of the plot. Each plot type has different settings, so new tabs will appear. Let's change it's content to be a time series chart:
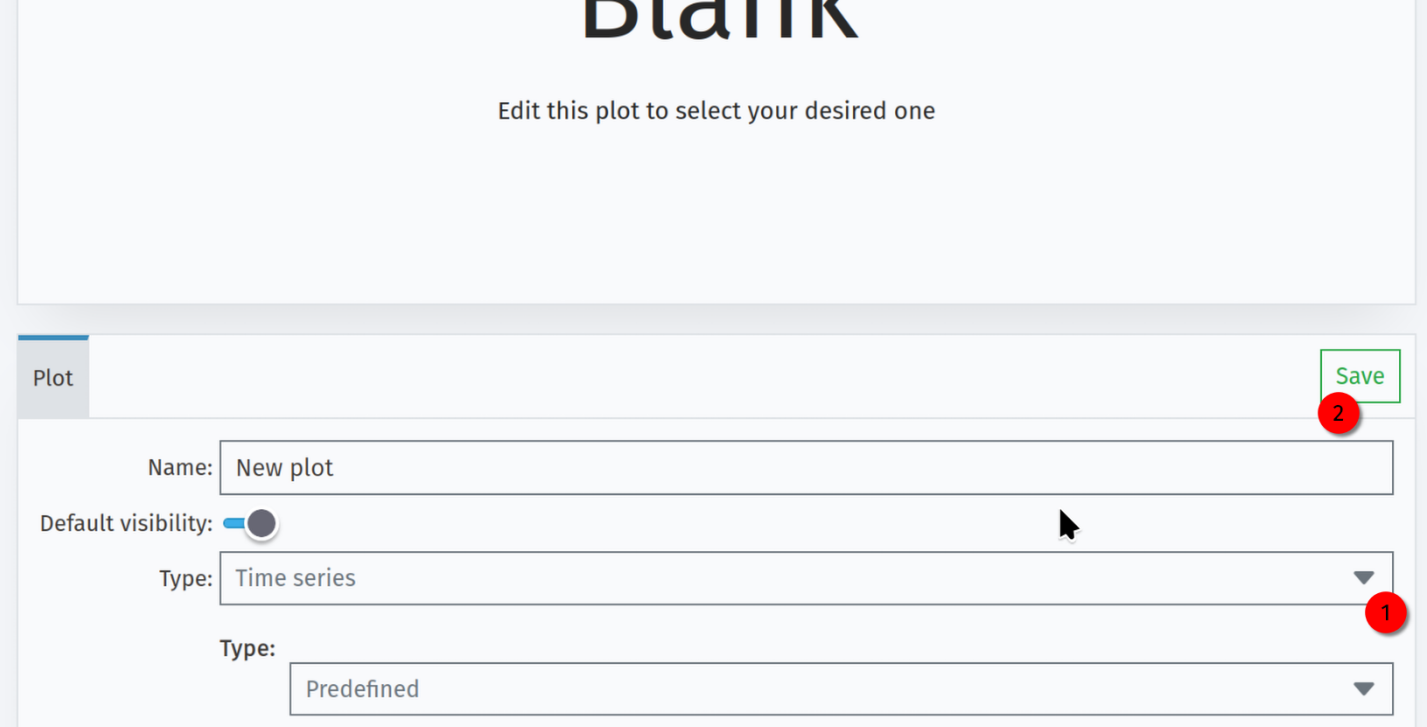
A time series chart is composed by series. A serie defines a way of rendering some specific data. A serie may contain none, one or many lines by the distinct values of some properties for example.
Let's create for now just a scatter plot, so that we can visualize the points that we are sending with the previously specified curl command. For that, let's go to the tab Series and click on the + symbol on the side of the content.
Great, the serie has been created, but the current settings of the serie contains no knowledge about how to render any data, so let's provide this data:
- Name is
Efficiencyfor example, or any other name you wish. - Type is
Single property. - Serie type is
Scatter. - Source is
First source. - Property is
efficiency.
The settings page should look as below after entering this data:
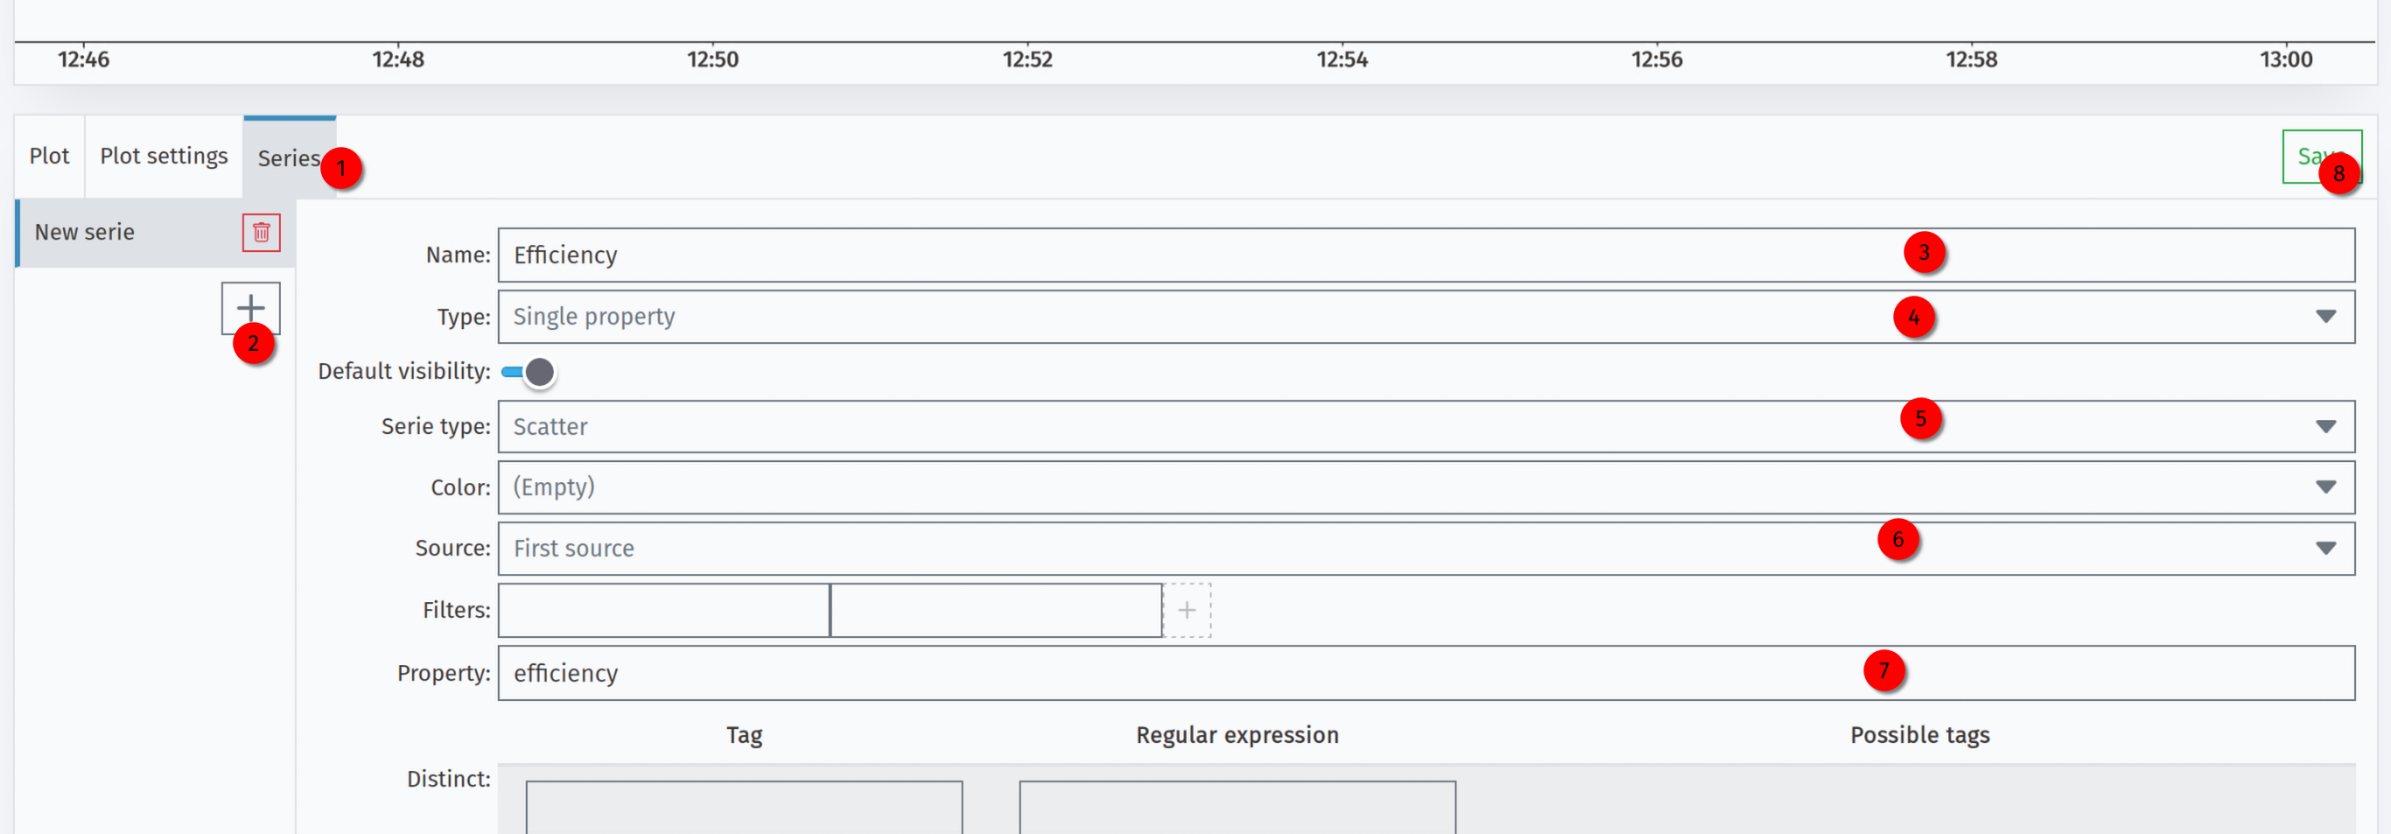
Let's click on save to save the changes. Automatically, the plot will reload and display our serie. If you see an empty plot still is because maybe the time frame that you are plotting does not include the point sent before, so do not worrry.
Let's send more points from a terminal so that we can see the data moving. This command will keep running for 20 seconds sending data:
for i in {1..100} ; do curl https://http.endpoints.flowerer.io/api/v1/d08dfc1f-5116-4f71-9a8c-9fd8a75e607d -d '{"tags": {"machine": "kp12-07","location": "Berlin","region": "Germany"}, "value": {"efficiency": 0.93, "speed": 42}}'; echo "Sent $i of 100"; sleep 1 ; done
You should see the data flowing in your screen.
Our plot edition is done, this is our first dashboard and we are going to publish it. The idea behind publishing it is that the version of the dashboard will be frozen from modification, so we can always come back to this specific dashboard. If we want to modify it, we will just create a new version and apply further changes.
For publishing, we will go back to the dashboard edition page by click on the arrow back:
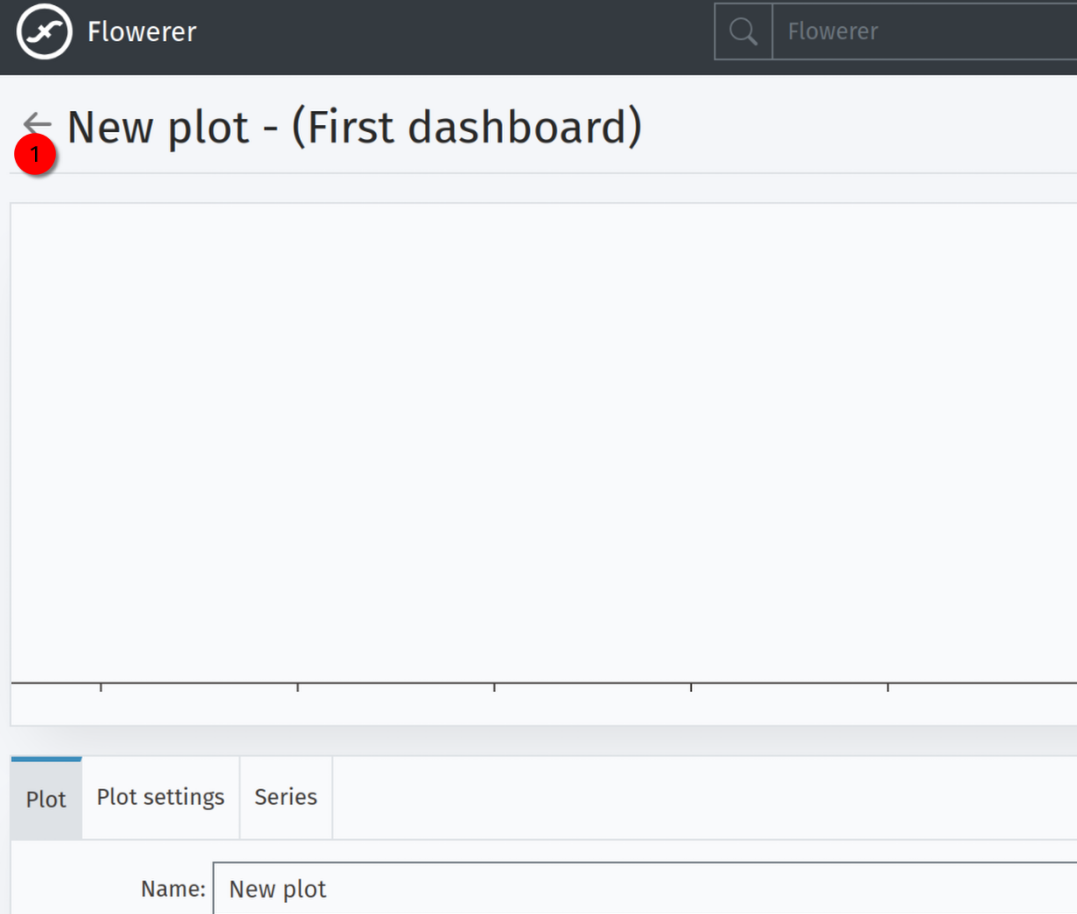
We click on the top right button of the dashboard edition page to Publish:

And we will see a modal that will ask us for confirmation of the changes. We can set this version as the currently active one (we may want to just commit the changes, but wait for publishing them for a different moment):

After publishing, the system will take us to the default page, where we will see the dashboard in the currently active version:

The tags indicate:
- In this control, we can quickly see any other version of the dashboard.
- If we go to the settings, we can create a public link (so that we can visualize the dashboard without login), or control which version is currently active.
We finish here our getting started guide. You have seen how to create a source, send data, and create a dashboard out of it. We encourage you to play with the system and navigate the docs to see the full potential of the platform. Do not hesitate to reach us if you have any questions.