Flowerer
Real-time monitoring and control
Flowerer provides real-time processing, storage, and visualization of incoming data, allowing users to make informed decisions quickly and efficiently.
Send the data
Send JSON over HTTP or MQTT. Or binary over TCP or UDP.
Storing and processing in real time
The data will be stored according to the defined retentions and broadcasted to any real time visualization.
Visualize, receive alerts or send commands
You will be able to interact with the data with real time visualizations, or receive alarm triggers or you will be able to send commands to your own devices or systems over the platform.
Interfaces
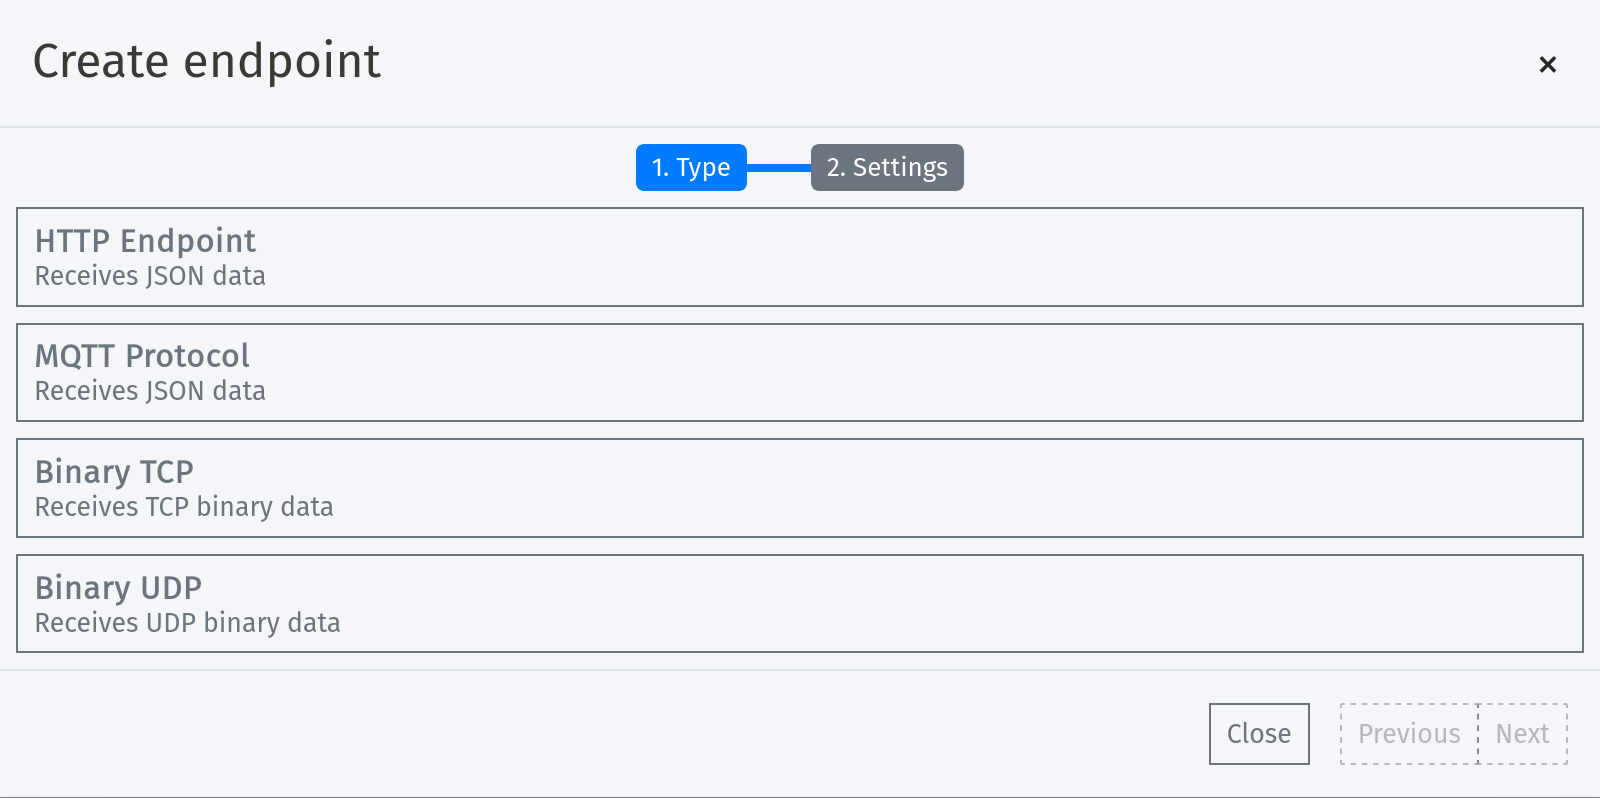
Flowerer exposes different services to injest data:
- HTTP
- HTTP POST with a JSON body. Allows some predefined transformations as from collectd.
- MQTT
- JSON can be also be published to an MQTT topic and the system will injest it
- TCP and UDP
- Binary data directly over TCP or UDP. Message format are defined in the system.
Other formats also supported
If you need that your binary endpoints automatically build the packet structure as neede, we have a library for that. If you need to send your Prometheus metrics, we have a Docker container with open source software for that. If you need CollectD, just use the default write_http plugin to send your metrics
Unstructured data
{
    "tags": {
        "machine": "kp12-07",
        "location": "Berlin",
        "region": "Germany"
    },
    "value": {
        "status": {
            "running": true,
            "error": false
        },
        "speed": 127,
    }
}
Flowerer stores it as
fe010001
// Binary represented
// in hexadecimal.

// Flowerer detects
// the types atuomatically.

// Tags are separated
// and do not count for storage.
Send any JSON, with any format. The system automatically calculates the type and indexes it. When sending {"tags": {"type": "speed"}, "value": {"speed": 3.14159}}, the system only counts this data point as 4 + 4bytes (the float number sent under the property value and the 4 bytes to represent the timestamp).
Explore your data
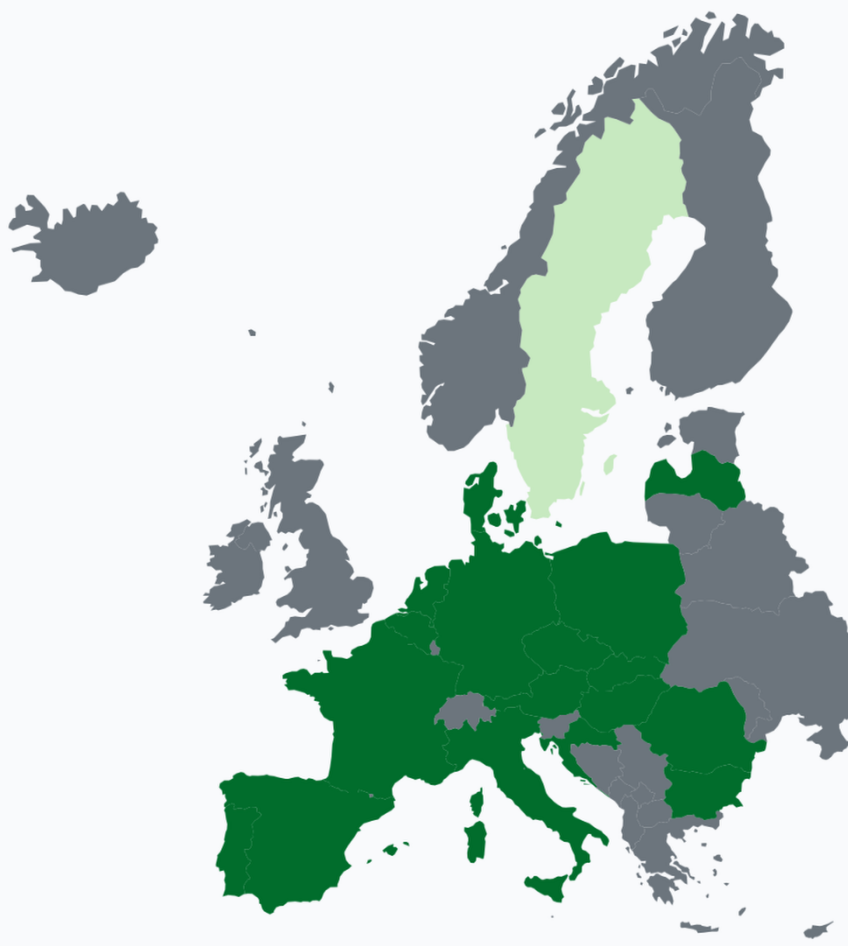
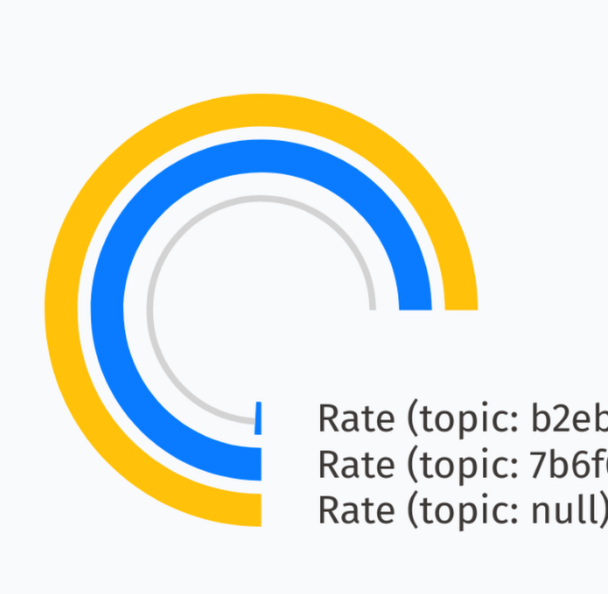
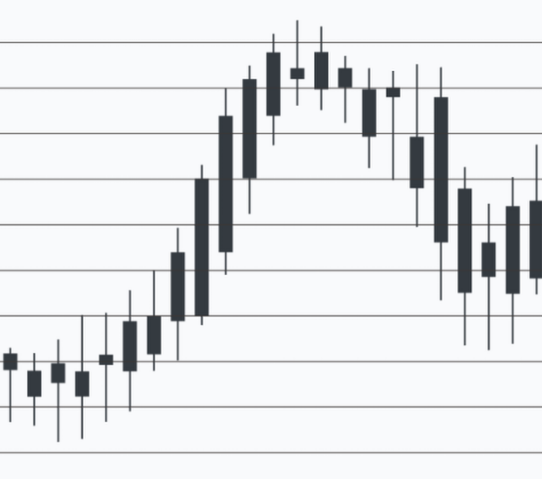

The use of varied chart types facilitate the exploration and analysis of data, leading to the extraction of actionable insights.
Visualization data transformation using Clojure-like syntax
Use syntax that resembles to Clojure to manipulate the data you visualize. Filter out, or just perform derive your visualization data from your raw data.
Alarming

Setting threshold values in alarming systems ensures that any deviation from the standard is immediately identified and flagged for further investigation, thereby preventing potential issues from escalating into major problems.
SCADA

Flowerer has the capability to work as Supervisory Control And Data Acquisition (SCADA) systems for remote monitoring and control of equipment and processes. This functionality enables users to manage complex operations from anywhere, providing greater flexibility and efficiency in their workflows.
Data retention

The duration for which data is retained in each tier of the system can be adjusted according to the specific needs of the user. It's important to strike a balance between data retention and cost, as keeping too much data for too long can become expensive over time.
Configuration versioning
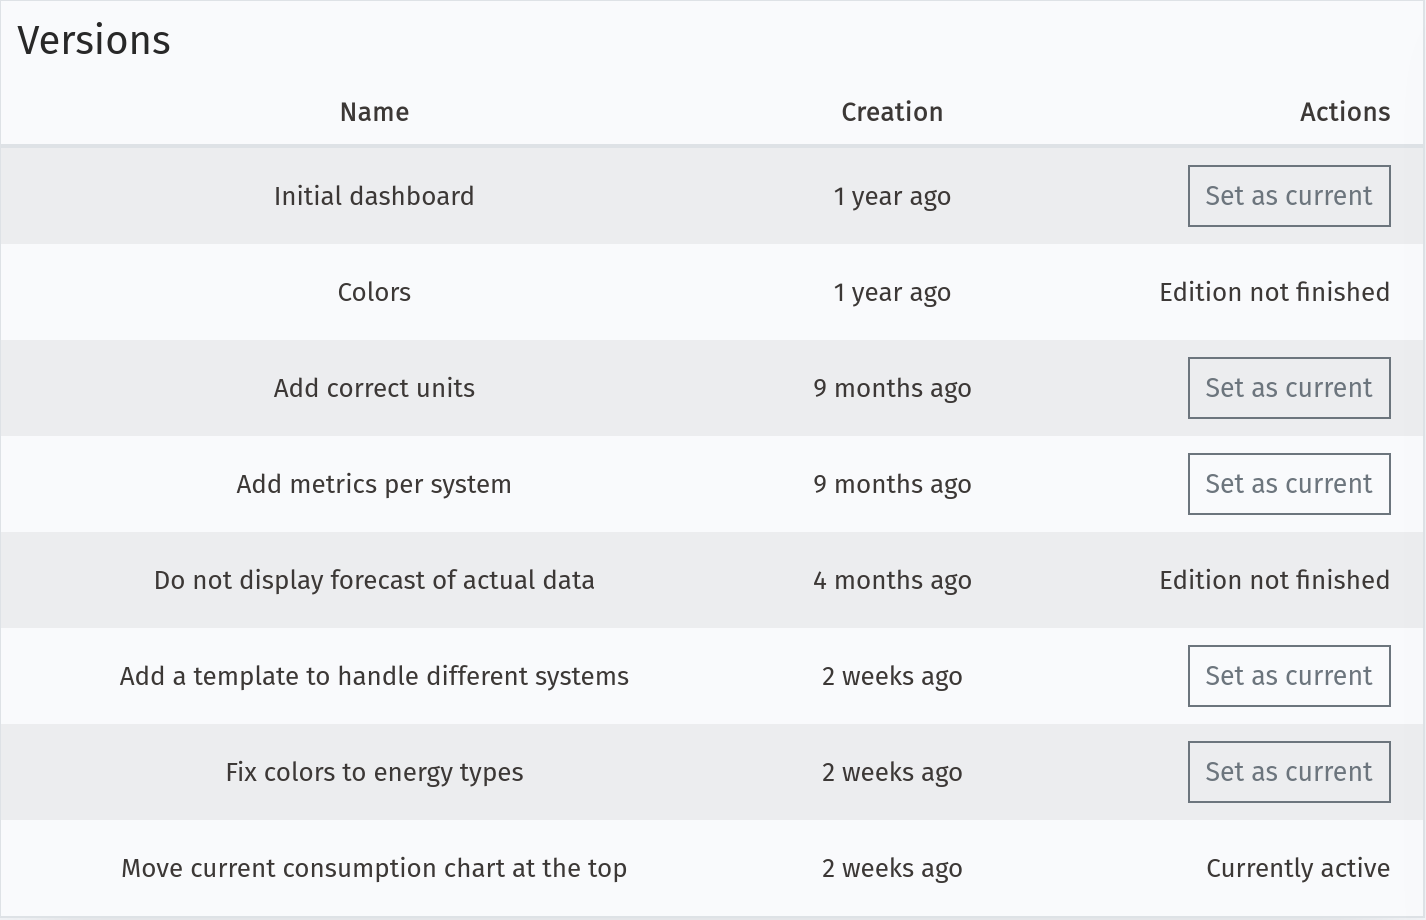
Make sure that the dashboards evolve with your needs, without forgetting how or why things were done.
Projection organisation
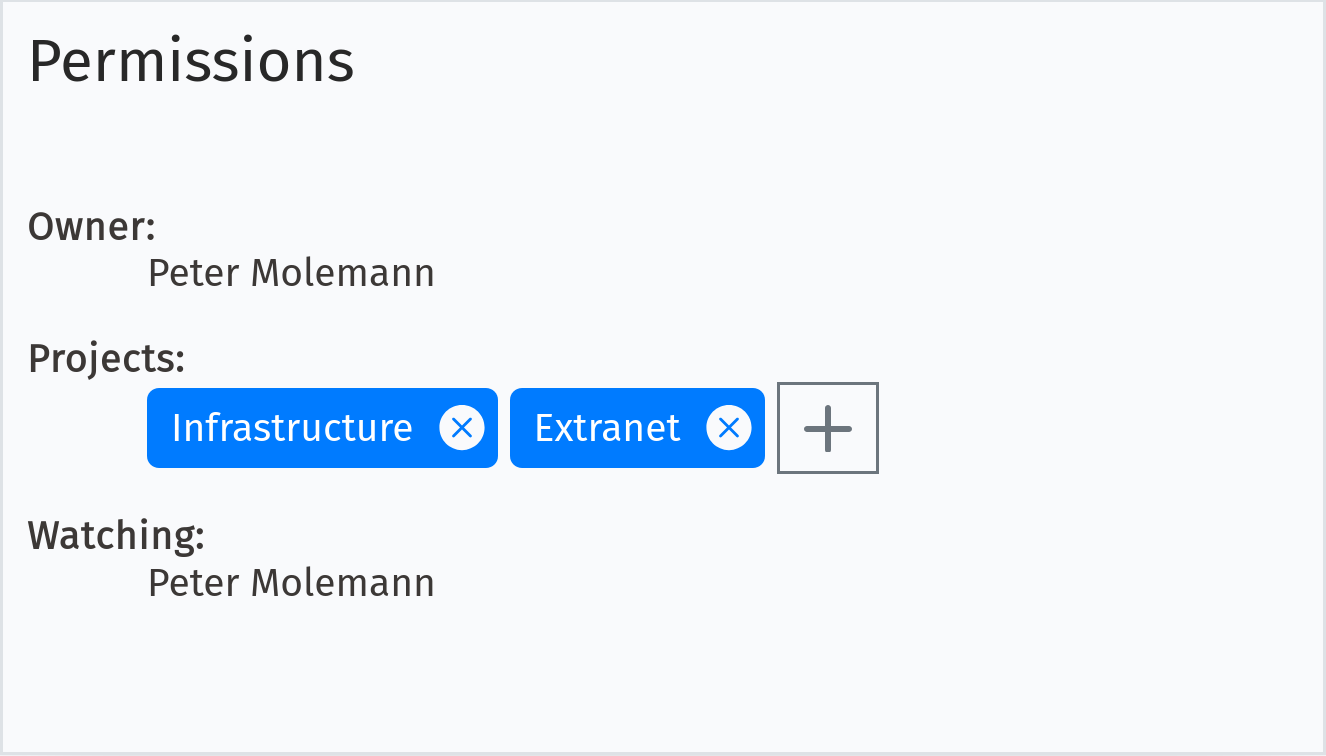
Organize your different needs in different projects, allowing different users to see or modify diffrent parts of the system.
Kiosk

If you need to share or expose in dedicated screens, you can generate URLs that have public access (and restrict the usage at any moment you wish).
Spotlight
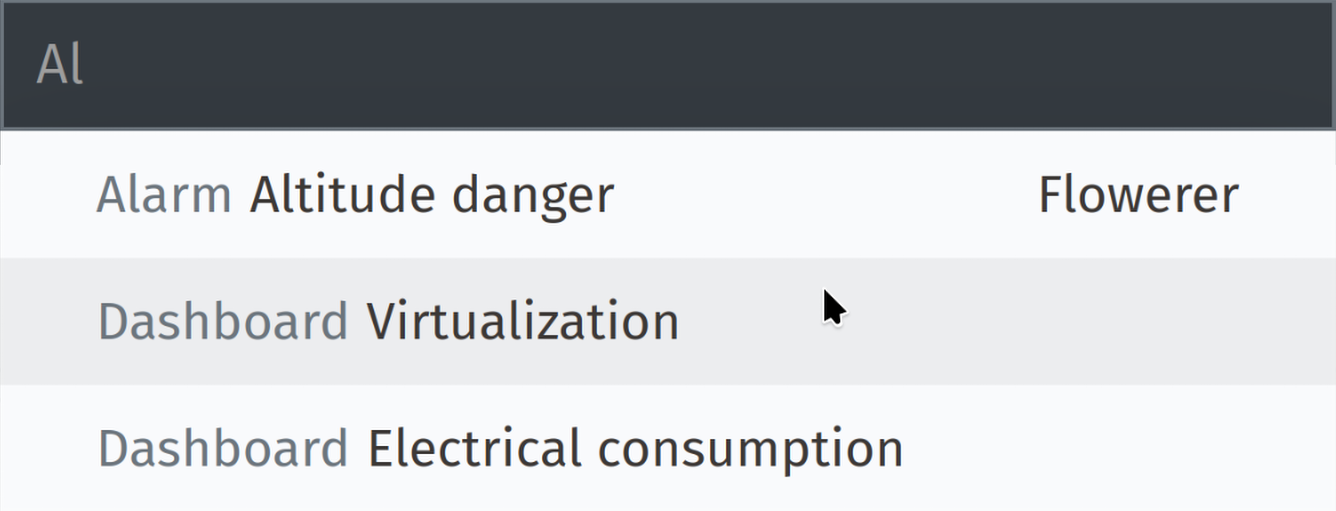
Quickly navigate througouth the system with many elements of help, like the spotlight, which will allow you to quickly jump.
1. "The logo of Prometheus – event monitoring and alerting software" by Alexander Schwartz is licensed under CC BY 4.0
2. "Logo of the free software project "collectd"" by Florian Forster is licensed under CC BY-SA 2.0 DE
3. WebGL and the WebGL logo are trademarks of the Khronos Group Inc.
4. "W3C SVG Logo" by Harvey Rayner is licensed under CC BY-SA 4.0